
Monitoring and evaluation - RIS3CV


Monitoring and Evaluation
The RIS3-CV monitoring and evaluation plan should contribute to facilitating decision-making for those involved in the implementation of RIS3-CV, to making judgments on results, to generating information for the citizens and, above all, to knowing and better understanding of the impact it will actually have.
Based on this premise, a system is proposed with a dual approach (general context and specific to RIS3-CV), where the indicators and metrics of each measure and objective try to converge towards the proposed strategic framework.
The structure is as follows:
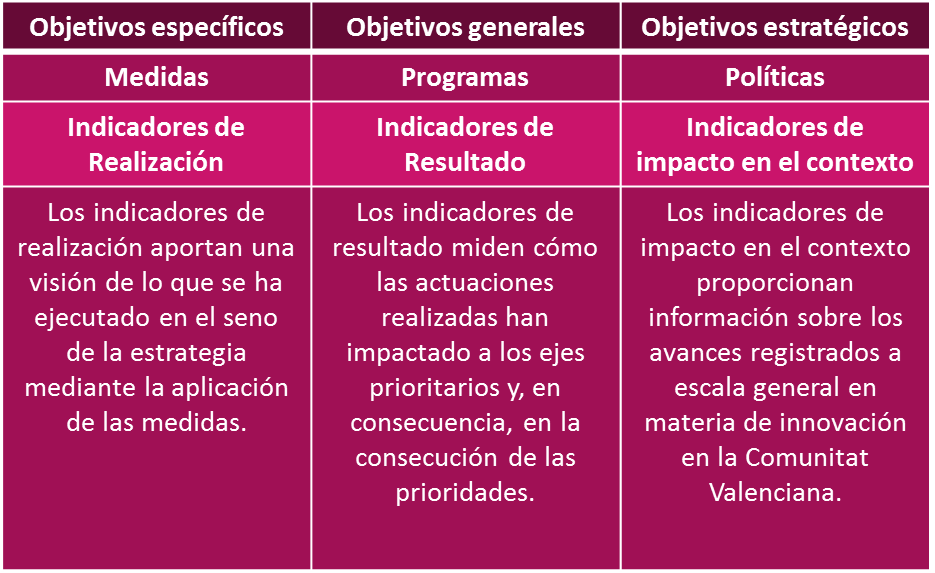
You can consult the detailed indicators of performance and results established for RIS3-CV, which is developed in the extended document RIS3-CV (in spanish). The context indicators are as follows:
|
INDICATOR |
Source |
Measuring units |
Ex ante value (2013) |
Inter-mediate value (2018) |
Final value (2020+3) |
||||
|---|---|---|---|---|---|---|---|---|---|
|
INPUT |
Higher education employees |
Spanish Statistics Office |
% |
33% |
35% |
40% |
|||
|
Population aged 30-34 years old with tertiary education |
Eurostat |
% |
41% |
45.85% |
47.80% |
||||
|
Expenditure on business innovation (% GDP) |
Spanish Statistics Office |
% |
1.22% |
1.5% |
2% |
||||
|
R&D expenditure |
Spanish Statistics Office |
% |
1.02% |
1.13% |
1.17% |
||||
|
R&D expenditure |
Spanish Statistics Office |
Mill. € |
998 |
1 049 |
1 070 |
||||
|
ICT investment |
BBVA-IVIE |
% |
1.67% |
1.9% |
2.2% |
||||
|
OUTPUT |
Scientific production (No. documents) |
SCOPUS |
Nº docs. |
11 745 |
14 422 |
15 492 |
|||
|
Invoicing for R&D and innovation services from Universities to Companies |
Network of Research Transfer Offices |
Mill. € |
36.50 |
60 |
90 |
||||
|
Patent applications by Valencian organisations |
Spanish Patent and Trademark Office |
Patents applied for per million inhabitants |
72.60 |
80 |
85 |
||||
|
Invoicing for R&D and innovation services from RTO to Companies |
IVACE RTO Indicators |
Mill. € |
47.70 |
70 |
100 |
||||
|
Relative rate of return in H2020 over European total. (Alternative condition) |
CDTI |
% |
0.79% |
0.95% |
1.00% |
||||
|
Relative rate of return in H2020 on national total (Alternative condition) |
CDTI |
% |
8.09% |
9.80% |
10% |
||||
|
Share of industry in regional GVA |
Spanish Statistics Office |
% |
15.40% |
18% |
20% |
||||
|
Number of companies with technological innovation activities |
Spanish Statistics Office |
Nº |
331 |
358 |
385 |
||||
|
ECONOMIC IMPACT |
Total employment |
Spanish Statistics Office |
Thousands of people |
1 793.5 |
2 000 |
2 200 |
|||
|
Employed in Science and Technology (core) |
Spanish Statistics Office |
Thousands of people |
19.80 |
22 |
25 |
||||
|
Employment in capital goods sectors |
Spanish Statistics Office |
% |
26.70% |
29% |
33% |
||||
|
Share of ICT occupations in regional employment |
Spanish Statistics Office |
% |
26.70% |
29% |
33% |
||||
|
Youth unemployment rate |
Spanish Statistics Office |
% |
59% |
40% |
30% |
||||
|
Personnel involved in R&D |
Spanish Statistics Office |
% |
1.03% |
1.03% |
1.03% |
||||
|
GDP |
Spanish Statistics Office |
M€ |
95 884 |
105 000 |
114 000 |
||||
|
GDP per capita (€/inhab.) |
Spanish Statistics Office |
€/hab. |
19 300 |
21 000 |
22 972 |
||||
|
TEA index (% of adults with new entrepreneurship in the last 42 months) |
GEM files |
% |
5.50% |
6% |
7% |
||||
|
Weight entrepreneurship in knowledge-intensive activities (national, regional) |
Spanish Statistics Office |
% |
25.40% |
27% |
30% |
||||
|
Companies with 50 or more employees compared to small companies |
Spanish Statistics Office |
% |
18.40% |
19% |
20% |
||||
|
No. of medium-sized enterprises (between 50 and 249 workers) |
Spanish Government. Dept. of Industry |
Nº |
1 773 |
2 040 |
2 139 |
||||
|
Export volume |
Datacomext. Spanish Government. |
% |
24.20% |
24.5% |
25% |
||||
|
Share in national port traffic |
Spanish Government. Dept. of Public Works |
% |
17.80% |
22% |
25% |
||||
|
Exports of capital goods |
Datacomext. Min. Economía |
M€ |
6 783 |
8 000 |
10 000 |
||||
|
% of regional companies that use ICT tools daily to manage their business and share information with their customers and suppliers |
Spanish Statistics Office |
% |
33.1% |
45% |
50% |
||||
|
Level of satisfaction by society with R&D&I carried out in the Valencia Region |
Technical Committee RIS3-CV |
Average points on a 0/5 scale |
n/a |
3.50 |
4.00 |
||||